
- Alphabet Inc.’s stock price is currently above the 50 and 100-day EMA levels.
- GOOGL’s stock price is currently trading at $122.21 with an increase of 1.8% in 24 hours.
- Alphabet Inc. (NASDAQ: GOOGL)’s live market cap is $1.56 Trillion.
Alphabet Inc. (NASDAQ: GOOGL) stock price is currently moving in an uptrend direction. The stock price of GOOGL is forming a higher-high pattern.
Alphabet Inc. (GOOGL) stock has a market cap of $1.56 Trillion with a revenue of $285.56 Billion. The GOOGL stock has a P/E of 27 and an EPS of 4.53. This denotes that the stock earnings are in positive figures and the stock price is at fair value.
The net profit of the Alphabet stock has increased from $13.62 Billion to $15.05 Billion in the last two quarters. The net profit is increased by an average of 9% per quarter.
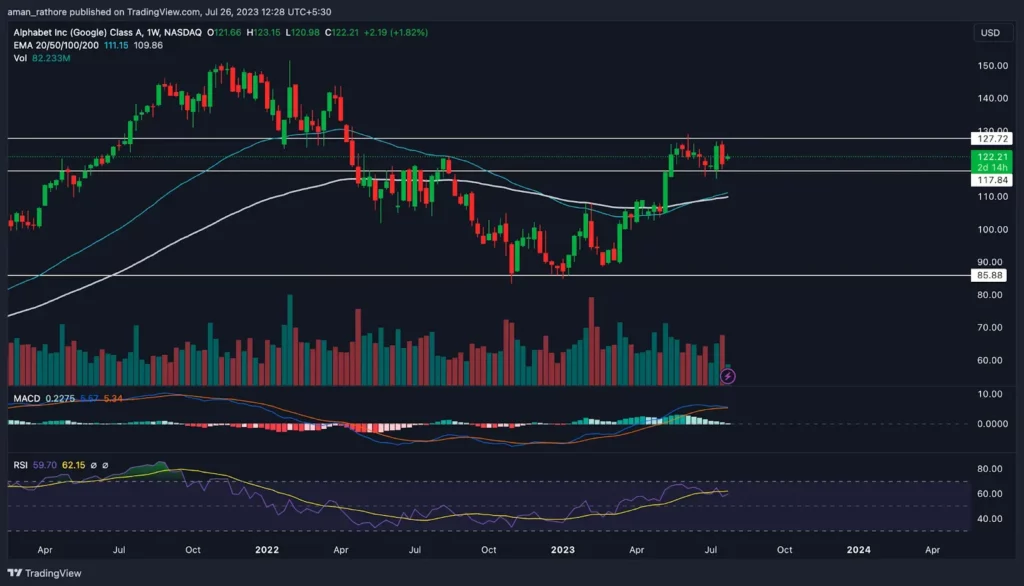
Alphabet (GOOGL) stock made a high of $151.55 in January 2022. Later, the stock price fell by almost -45% in nine months. However, the stock found support at the $85 level and the price rebounded from there. Since then, the stock price gave rise by 55%.
The stock price is currently facing resistance at the $127 level and the price tried moving near this level for the last 7 weeks. If the price breaks above this level, a further up move is expected.
The overall structure of the Alphabet stock is forming a strong positive pattern and the price is likely to move above in the upcoming days.
Alphabet Inc.(GOOGL Stock Price Analysis)
EMA
Alphabet Inc. (NASDAQ: GOOGL) stock price’s 50-day EMA and the 100-day EMA are both trading below the current price. This suggests that Alphabet Inc. is now in a bullish trend and that further price appreciation may be possible.
MACD
The MACD for GOOGL is higher than the signal line and both the lines are above the 0 line. It can clearly see the green histogram is forming which is a sign that the upward pressure on the stock will continue to grow.
RSI
Both the 14-day Simple Moving Average (SMA) line and the Relative Strength Index (RSI) line are near 70. The positive RSI line indicates that the price is likely to rise in the future.
Conclusion
The results of the study suggest that the Alphabet Inc. stock price (GOOGL) is in an uptrend and the price is likely to rise in the future. The price is making higher highs and the indicators are indicating a bullish outlook. Therefore, the stock price is likely to remain on an upward trajectory in the coming days.
Technical Levels
- Support Level– $117
- Resistance Level– $127
Disclaimer
The views and opinions of the author, or anyone named in this article, are for informational purposes only. They do not offer financial, investment, or other advice. Investing or trading crypto assets involves the risk of financial loss.


 stock price is currently moving in an uptrend direction. The stock price of GOOGL is forming a higher pattern.)