
- After a contraction in volatility price breaks out of the critical resistance level.
- Previously when LTC broke out of this resistance level, it rallied 290%. Will history repeat?
- The medium-term trend stays up. What does it mean for the bulls?
LTC Price Analysis
LTC was developed to provide a faster and safer digital payment platform. It has a meager transaction fee, making it suitable for low transaction amounts and point-of-sale payments. LTC is one of the most widely accepted cryptocurrencies. More than 2000 stores globally accept LTC.
LTC/USD PRICE ANALYSIS (WEEKLY)
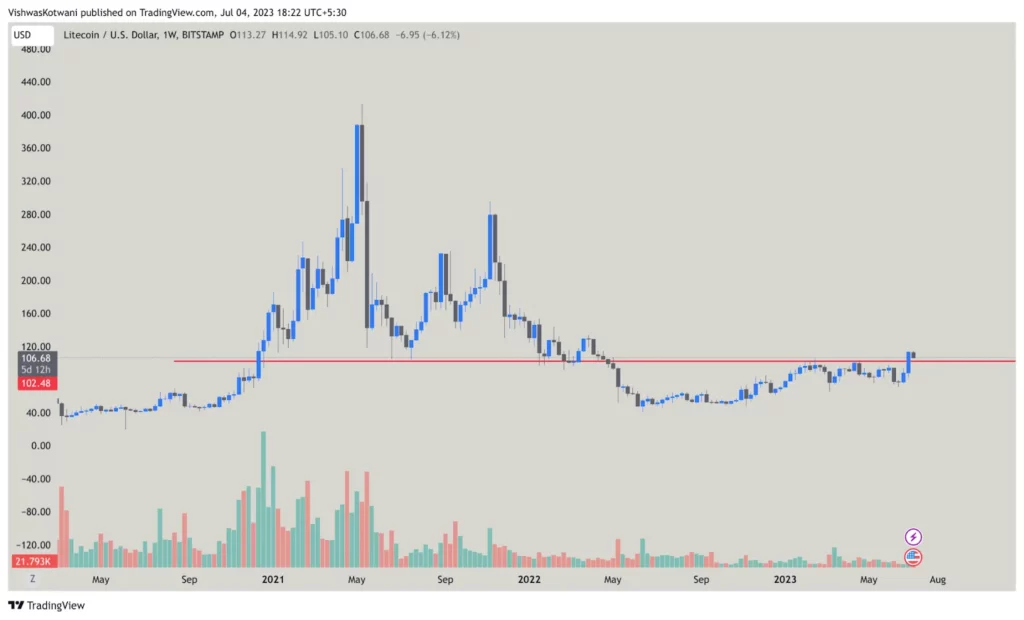
The LTC/USD chart trades above the critical resistance level of $102.48. Why key resistance? The level of $102.48 previously in the year 2021 was a support level from which the price used to bounce. Per the principle of polarity, the support, when breached on the downside, becomes the resistance level once the price takes a pullback.
Now, the price is comfortably trading above the resistance level. Thus, $102.48 will now become a fundamental support level as well. TIll the time price is dealing above $102.48, bulls will be in control.
If bears take the price below $102.48, the following buying support will come to around $80, which is another 20% down from the price at the time of press.
LTC Interesting Observation
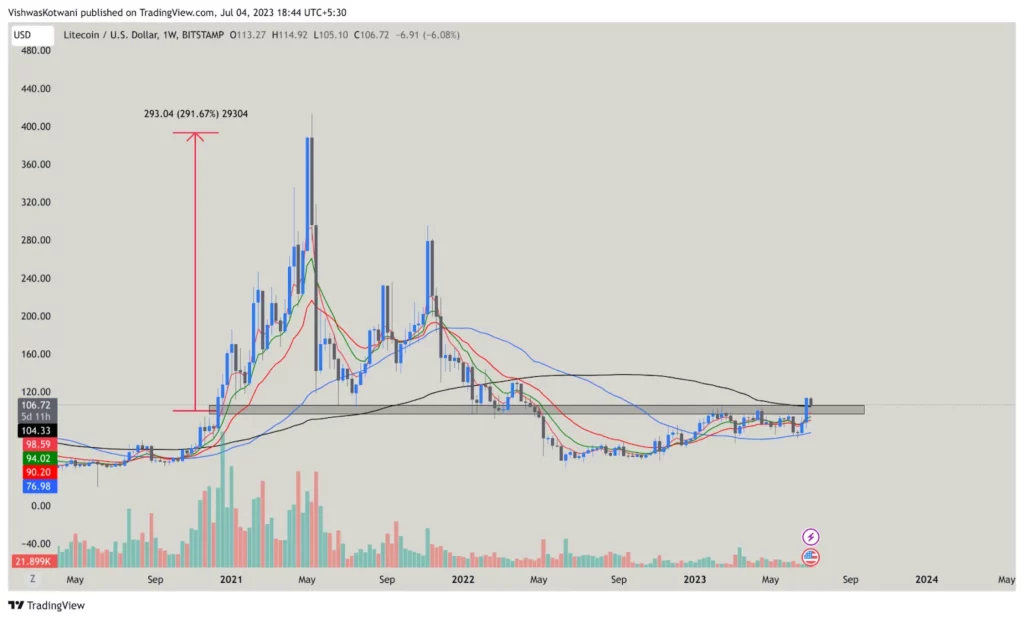
Last time when the price of LTC/USD broke out of this fundamental resistance level of $102.48, it gave the buyers a whopping 290% return. Will it repeat this time?
Time will tell. However, the medium-term trend based on the weekly chart currently stays strong and upwards. So we must consider the possibility of LTC testing its next target zone again.
The weekly chart of LTC/USD is trading above all key moving and exponential moving averages. Thus, the trend stays up. The slope of the moving averages also turns upwards, confirming the direction of the movement.
LTC Indicators
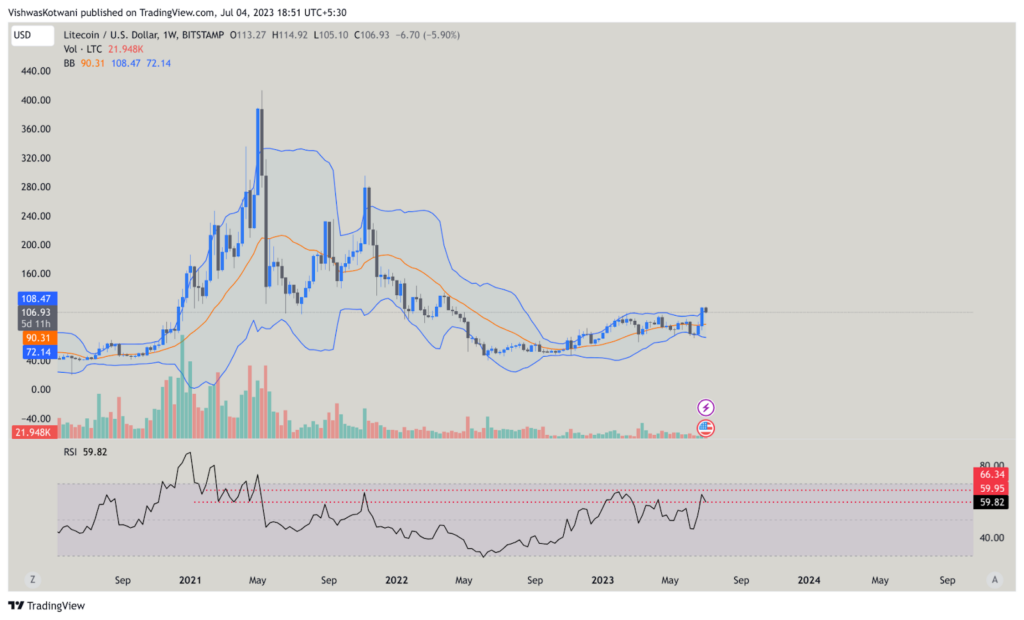
The most significant volatility contraction indicator has expanded on the upside. The price on the weekly chart has broken out of the Bollinger band resistance level. The price and indicator resistance has broken out on a weekly time frame, indicating traders/investors about the trend.
It is always better for traders to be with the trend rather than going against it. However, all the tradable asset classes prevail over downside risk. It is up to the trader/investor how much trouble they can take per the risk appetite.
Some key technical levels for risk management purposes are: For August.
Support level: $102.40
Resistance level: $129.40
Disclaimer
The views and opinions stated by the author, or any people named in this article, are for informational purposes only and do not establish financial, investment, or other advice. Investing in or trading crypto or stock comes with a risk of financial loss.


