
- ApeCoin price prediction reveals that the price is under sell pressure
- APE price reported a year-to-date loss of 47%
- ApeCoin is forming a bullish divergence on the daily time frame.
ApeCoin price prediction reveals that the market has been under bearish dominance since February 2023. Prior to this, the APE token witnessed a surge of 118% between November 2022 and January 2023. The price climbed to the resistance level of $6.292. Since the bears took control, ApeCoin has lost almost 70% in value and it is trading in a crucial support zone of $1.93.
At the time of writing, the current market price of APE is $1.924. The 24-hour trading volume fell by 0.23%. The market is up by 1.09% in the last 24 hours. The overall market cap of APE tokens is $709,884,565.
Will ApeCoin Rebound From the Support?
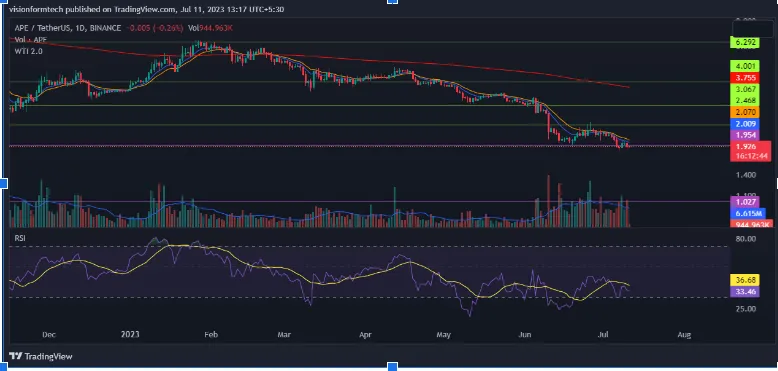
ApeCoin price prediction highlights that the market has been selling for the last few months. The Bulls were unable to hold the support levels which has led to this sharp fall. According to the technicals, there are no significant support levels in this zone.
The price keeps printing a series of lower lows which is troubling investors. APE coin is at risk of falling to its all-time low of $1. The crypto asset is relatively new and the data is insufficient to make accurate predictions. However, The RSI is creating a bullish divergence indicating that the sellers might be getting exhausted and recovery may be possible in the short term.
The Price is Trading at Crucial Support.
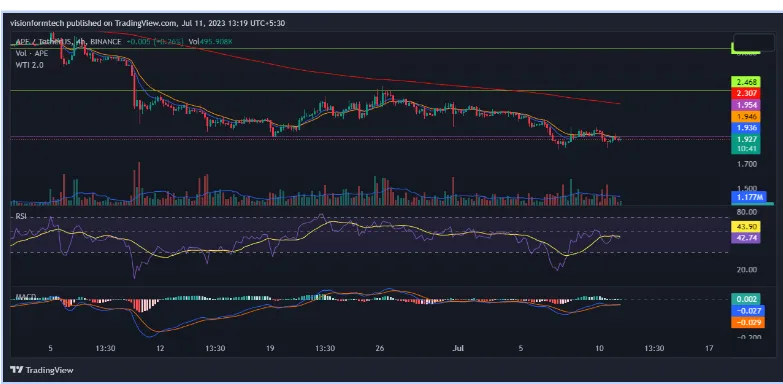
The 4-hour chart displays a series of lower lows where the price is trading below the support. The market is in extreme fear. The bulls tried to reclaim the resistance of $2.468 but got rejected by the sellers. The APE price forms a double bottom pattern.
This may invite some investors as the prices are already low. The current level may offer a decent risk-to-reward as the stop loss can be set just below the swing low. If the market reverses from here, the price has to break multiple resistance in order to sustain a bullish recovery.
RSI: The RSI indicator is currently at 42.43 on the 4-hour. The price is in bearish territory and the market is weak. The prices are expected to move down until RSI crosses 50.
MACD: MACD made a bullish crossover. However, the MACD and signal Line are still below the 0 line. The market may consolidate in a sideways price action until the indicator crosses the line.
200 EMA: On the 4-hour chart, the price is trading below the 200 EMA. This is a bearish sign and an indication of bearish dominance. The 200 EMA acts as a dynamic resistance and the prices may continue to slide down until the price breaks above the indicator
Conclusion:
ApeCoin price prediction reveals that the market has been under bearish dominance since February 2023. The market is trading on a crucial support level. There are no major signs of reversal so far. Meanwhile, the RSI is showing signs of bullish divergence on the daily timeframe. It is best to wait for confirmation before entering any position while following a proper risk management plan.
Technical Levels
- The nearest support level: $1.838
- The nearest resistance level: $2.468
Disclaimer:
The views and opinions stated by the author, or any people named in this article, are for informational purposes only and do not establish financial, investment, or other advice. Investing in or trading crypto assets comes with a risk of financial loss.


