
- Binance Coin (BNB) is currently trading at $243.49 with a rise of -1.07% in 24 hours.
- Binance Coin (BNB)’s live market cap is $37,960,860,120.
- Binance Coin (BNB)’s 24-hour volume is $408,27,931 which rose by -38.89% in 24 hours.
As per the analysis of the Binance Coin (BNB) chart weekly, we can say that the coin is in a downtrend direction.
Binance Coin has shown a significant long-term increasing trend since its launch. The cost of BNB has risen substantially over time. However, it is now in a decline and producing a horizontal channel pattern, which indicates the price is moving in a channel.
Binance Coin hit a maximum price of $703.12 over two years ago; since then, it has dropped by -70.08% in just eight months. As previously said, the currency now has a low volume available, indicating there aren’t enough buyers due to unfavorable market emotions. Currently, the price is trading near to the support and it is highly likely it will trade near the zone for a few more weeks.
Binance Coin (BNB) Price Analysis
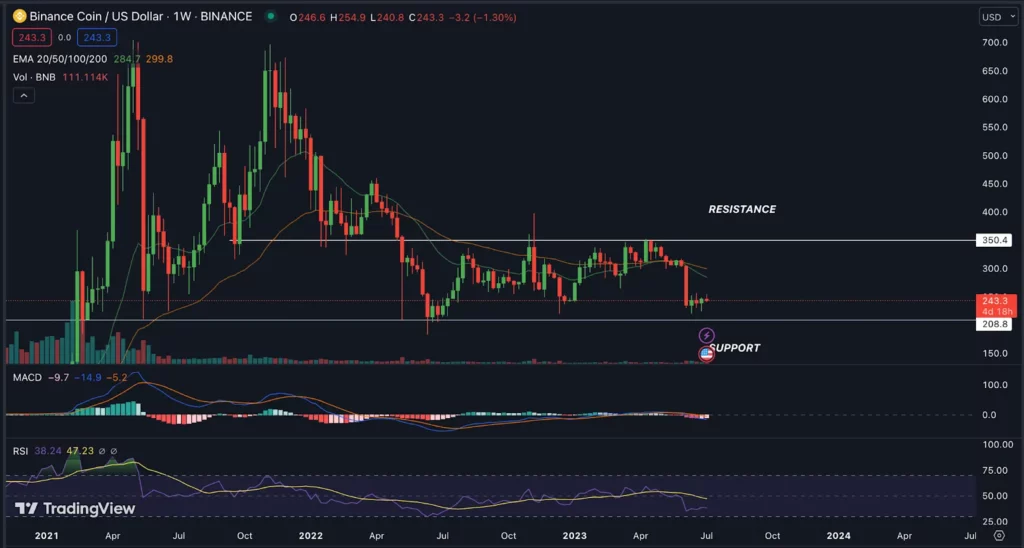
EMA:
The price of Binance Coin (BNB) is currently trading below the 20–50 day EMA daily, which is not a good sign. The price of Binance Coin (BNB) is experiencing bearish momentum. Overall price may fall in
MACD:
The MACD indicator aids in identifying developing trends, bullish or bearish market situations, and variations in momentum. The chart includes the MACD line, the signal line, and a histogram that shows the difference between the two lines.
Binance Coin’s MACD line, which is now trading below the daily period’s signal line, is giving a negative signal. Red histograms indicate rising bearish momentum. This means that the price of Binance Coin may soon fall more.
RSI:
The RSI, or relative strength index, is a momentum oscillator that gauges how quickly and dramatically prices fluctuate. It fluctuates between 0 and 100, with values over 70 indicating overbought areas and values under 30 indicating oversold areas. The current RSI reading is 37.92, and the 14 SMA line below the median line is at 46.79, indicating bearish market momentum.
Volume Analysis:
The Binance Coin (BNB) 24-hour trading volume is $462,604,901 with a decrease of -38.89%, and it is a huge decrease in volume in a day. This indicates an overall decrease in market activity and sellers are active from the higher level.
Conclusion
Binance Coin (BNB) is now flashing a negative signal on the weekly time frame, according to technical indicators. The MACD causes the negative crossing, and the RSI also provides negative indications. The current price of Binance Coin (BNB) implies uncertainty for the near future, and the EMA analysis predicts a bearish short-term trend.
Technical Levels:
- Support – The current support level of the Binance Coin (BNB) is $14.9010.
- Resistance -The current resistance level of the Binance Coin (BNB) is $19.0789.
Disclaimer
The views and opinions of the author, or anyone named in this article, are for informational purposes only. They do not offer financial, investment, or other advice. Investing or trading crypto assets involves the risk of financial loss.


 hit a maximum price of $703.12 over two years ago; since then, it has dropped by -70.08% in just eight months.)