
- NEARCOIN ERODED MORE THAN 90% OF THE GAINS FROM THE HIGHS.
- NEARCOIN IS TRADING NEAR TO ITS 52-WEEK LOW LEVEL I.E. $ 0.91.
- NEARCOIN PRICE IS STRUGGLING TO RISE FROM THE BOTTOM.
CURRENT MARKET PRICE OF NEAR COIN – $ 1. 52
MARKET CAPITAL OF NEARCOIN – $ 1. 086 B
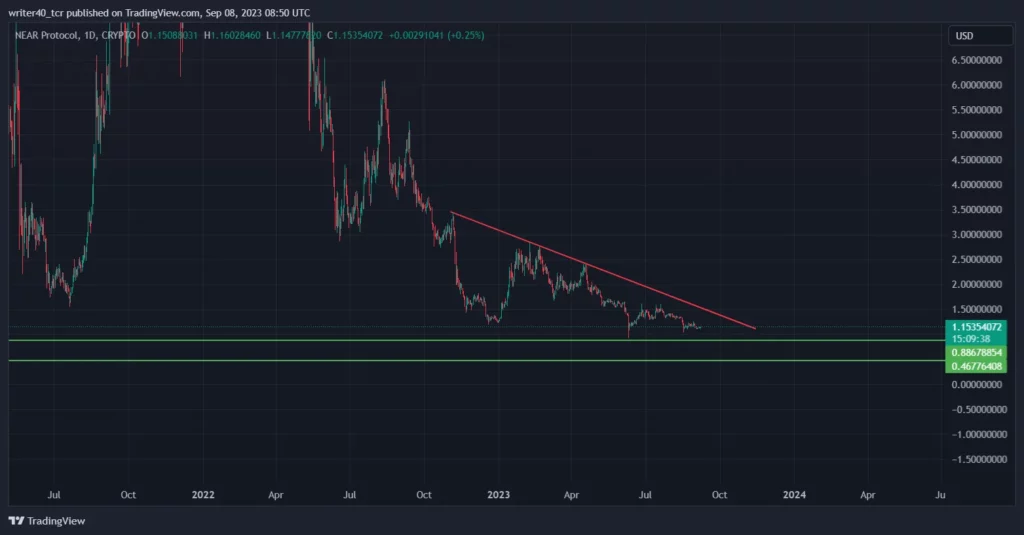
Nearcoin price is continuously feeling pressure from sellers as the price has been trading near its 52-week low for so long, it tried to escape from the base in June when it rallied for more than 50% from the bottom but in August the price saw a huge decline in price where the price fell 3 days in a row i.e (- 4 %), (- 5 % ) and (-7 %) respectively to come back to the base.
Nearcoin is falling with heavy bearish candles but the same momentum is not visible on the buying side which indicates that the sellers are more aggressive on this counter and are present at each level.
The price is feeling the pressure as the downward-sloping trendline is continuously pushing the price downward and till the price is below that trendline it is expected that the sellers will try to push the price down.
Some buyers are active near the bottom of the candle it made on 10 June when the price saw a huge decline of 33% intraday and at $ 0 .92 levels price rebounded and closed only in (-13 %). The price again took the support from $1.04 levels from where it showed some upside and now again testing that support and forming some green candles.
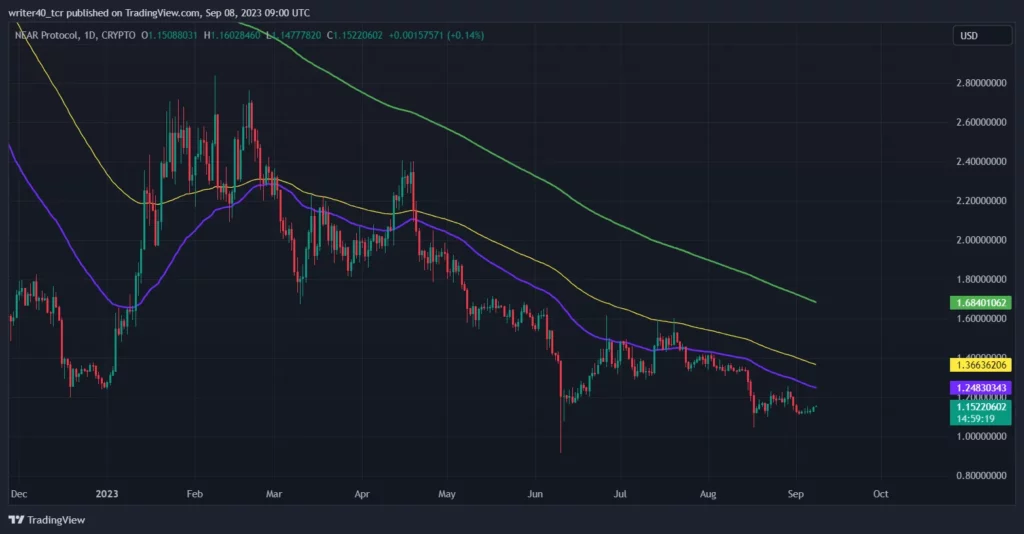
If we talk about the major EMA levels then the price is trading below 50, 100, and 200 EMAs which is a sign of a bearish trend and the slope of EMA is steep which means the bearish trend is strong.
The price will face rejection from these levels as along with them the supply zone is colliding with where the price is facing rejection which will make it difficult for the price to go up.
IS THE PRICE GAINING THE NECESSARY MOMENTUM
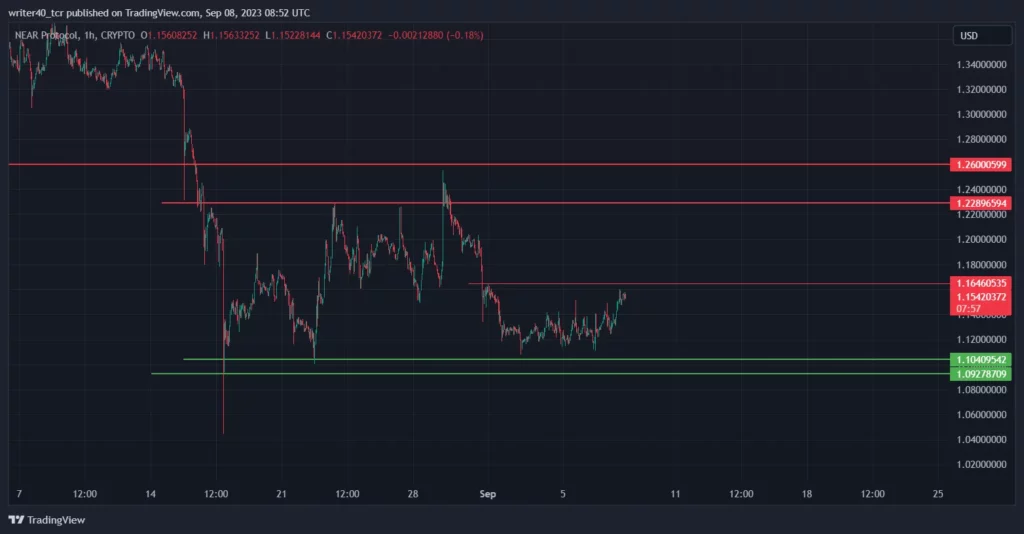
On the 1 hour chart, the price is showing strength as it is continuously moving up which is a good sign for the buyers but the major hurdle for the buyers is to cross the $ 1.164 level where the resistance is present.
$ 1.22 and $ 1.26 is the level where the most sellers are active and if we talk about the support levels $ 1.10 is acting as a major support level on both time frames.
Nearcoin is very volatile in this range as it is facing a decline on every rise there is no strong momentum on either side as the price is giving zigzag moves and cutting the stop loss of traders.
CONCLUSION
As the price is in a strong downtrend once the price breaks any resistance then only we can see some positional buying, some sellers are spotted near $ 1.16 levels and the strong supply zone is $ 1.22 – $1.26 levels so if the price crosses $ 1.16 levels and move toward $1.22 levels and gets successful in breaching that levels then it can find some pace for upside move.
$1.10 and $1.092 a strong buyer’s areas and if the price breaks we can witness more panic selling on this counter.
PAST PERFORMANCE
1 WEEK- – ( 0.40 ) %
1 MONTH- – ( 15 .29 ) %
1 YEAR – – ( 73. 65 ) %
TECHNICAL LEVELS
- RESISTANCE- $ 1.22 AND $1.24
- SUPPORT – $ 1.10 AND $1.09
DISCLAIMER
The views and opinions stated by the author, or any people named in this article, are for informational purposes only and do not establish financial, investment, or other advice. Investing in or trading crypto assets comes with a risk of financial loss.


