
- ETC can reach $19 in 2023 if it takes support from $14.76.
- It is currently trading at $15.42 with an intraday gain of 0.69% in the last 24 hours.
- The token has been in a significant downfall for a very long time.
ETC has been in a bearish downtrend lately. In the last 6 months, It lost a quarter of its value. The ETC price has continuously declined in the daily time frame.
The token is currently down from its all-time high by 91.23%.
The token marked its all-time high on 7th May 2021, when the token was priced at $176.16. The token is trading with a 25% fall in its 24-hour volume.
- The market cap of the token is $2.2 Billion.
- It has a circulating supply of 142,877,626 ETC, which is 67.81% of its total supply.
- The token has a trading volume of $43.64 Million in the last 24 hours.
ETC Sentiment Analysis
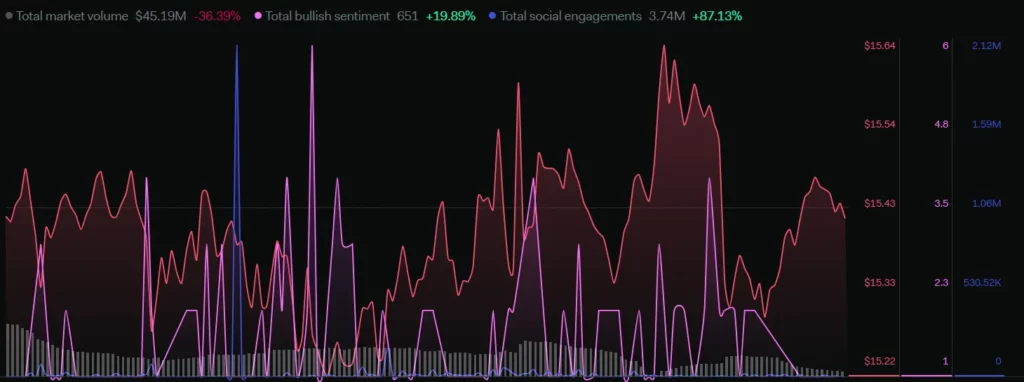
The total market volume of the token decreased by 36.39%. The total bullish sentiments surged by 19.89% as the price approached the support level in the weekly timeframe. Its total social engagements grew by 87.13% showing an increased activity in the social community.
ETC Coin Technical Analysis
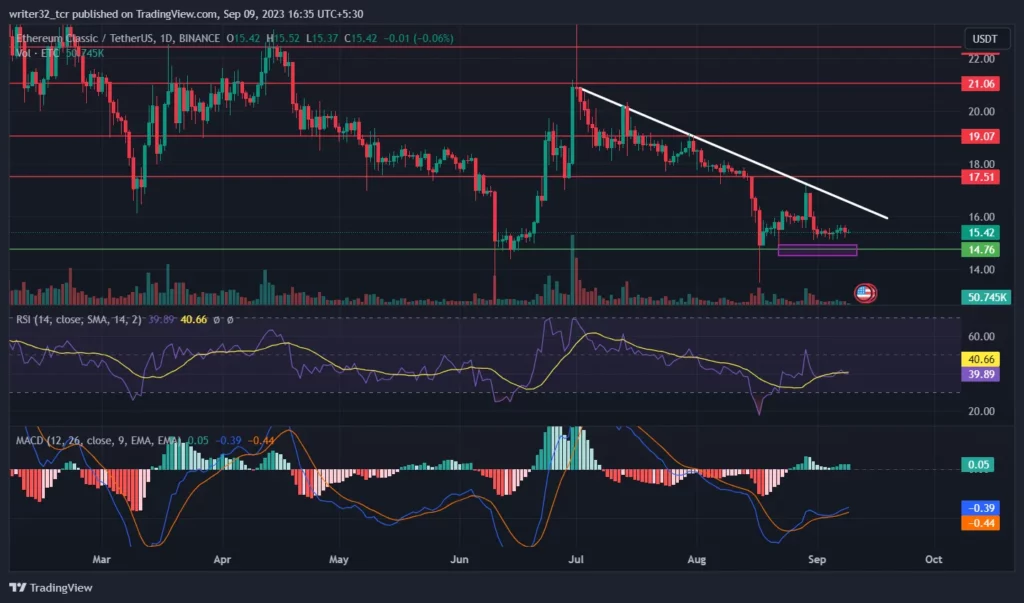
The token has been in a bearish trend after the price declined from the $21 resistance. Token value has been trading below the white resistance trend line as shown in the chart.
The $14.76 has been a major resistance for the token as from here the price has almost bounced about 5 times.
The price is likely to create a potential double bottom after successfully retesting the support from where the token will shoot up towards a bullish trend.
If the stock declines from the same resistance line, it can fall again and continue under the white resistance trendline. Also, If the price rises above this resistance line and $17.5 resistance, then we can easily reach the $19 mark.
The RSI is at 39.89 points and the SMA 14 is at 40.66 points, which shows that the token is in an oversold region and below the neutral level. If the RSI line bounces from SMA 14 and gets above the neutral levels with the increase in volume, we can say the stock is in a bullish trend.
The MACD is showing a bullish divergence as the fast blue line is moving upwards. The volume in the histogram is showing an increase in volume in a daily time frame.
If things go negative and the price breaks the $14.76 support, the token can fall to the $12.6 range.
Conclusion
The bullish trend will be confirmed after the price retests successfully from the $14.76 range and breaks the white resistance line. The decline from the white resistance line will continue a further bearish trend.
Technical Levels
- SUPPORT: $14.76
- RESISTANCE: $17.5, $19.07 and $21.06
Disclaimer
The views and opinions stated by the author, or any people named in this article, are for informational purposes only and do not establish financial, investment, or other advice. Investing in or trading crypto assets comes with a risk of financial loss.


