- Energy price augury: The revenue of the stock was reported at $74m but the company’s net profit negative
- The Gross profit margin has declined compared to the past quarters
- The price is in an uptrend and is about to break resistance; should you go for it?
C3.AI is a US-based company founded in 2009 and listed on the New York Stock Exchange (NYSE). The company specializes in developing artificial intelligence software to facilitate digital transformation. They offer an AI suite designed for development, deployment, and operations on a large scale. Thomas Siebel serves as the CEO of C3.ai, while Edward Y Abbo holds the position of CTO.
Latest Quarter’s Highlights for the Stock
- The revenue was standing at $72m as reported on 30th of April 2023
- The gross margin of the stock currently is at 67% which has seen a decline from 2021, as 75%.
- Currently, the stock is in loss as the Net profit margin comes up to -100.77%
- The stock PE stands at 39 which can be considered as a high price-low earnings ratio.
- The quarter’s Earnings per share comes up as $-2.45
The Metrics have been calculated as per financial statements provided by macrotrends.net
AI Stock’s Previous Price Action and Forecasting
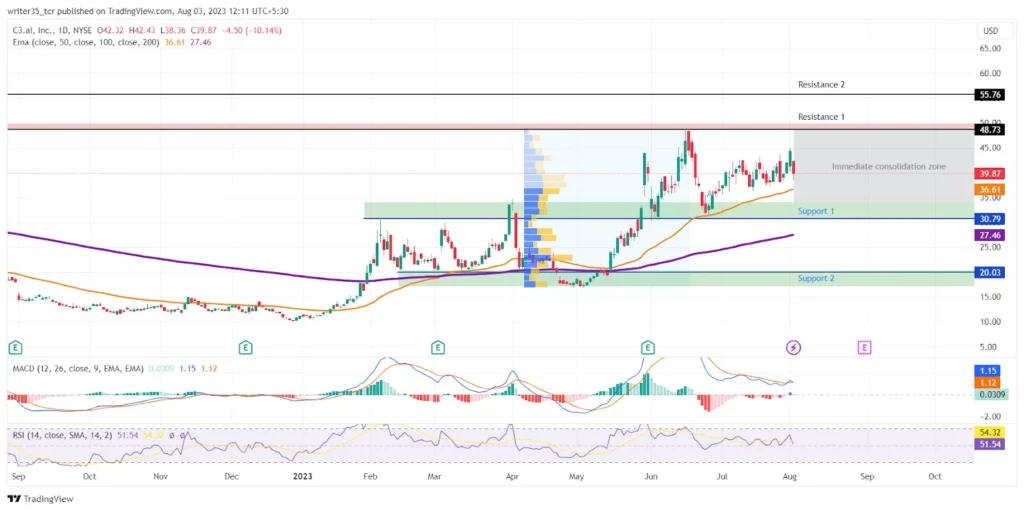
In January 2023, the price of C3.ai stock exhibited a notable uptrend, starting from $10.95 and rising to $21.34 by the end of the month. February saw a remarkable surge as the stock reached a high of $30, representing an impressive 173% increase compared to January’s opening.
More recently, in June, the stock successfully broke through the resistance levels it had previously established back in February 2023. This indicates continued strength and bullish momentum in the stock, potentially signaling further upward movement.

ET‘s Current Price Action and Technicals
As of the current analysis, the stock is trading around $40 after a period of consolidation in recent weeks. In the short term, the stock faces resistance at around $43 and has a floor of support at approximately $37. There are additional support and resistance levels in view.
The immediate resistance is at $48, which was confirmed back in November 2021. Beyond that, the second resistance level stands at $55.76.
On the other hand, the support levels are more broad due to higher trading volumes in recent times. The first support level was formed after breaking the resistance at $30.7. The second support level is at $20, with certain volume levels offering potential cushioning.
Indicators
MACD
The recent crossover of the MACD line with the signal line, though very close to each other (MACD at 1.15 and signal line at 1.12), suggests a potential uptrend for the stock.
RSI
The RSI, which was in the overbought zone with a level of 72, corrected and moved toward the midline. Currently, the RSI stands at 54, indicating a sideways movement for the stock.
EMA’s
A crossover occurred in March when the 50 EMA crossed the 200 EMA, resulting in an uptrend that has continued until today. The 50 EMA is presently very close to the current price level at $36.61, while the 200 EMA is at $27.46.
If the stock breaks the resistance at $48, which is in close proximity to the current price, it may reach $55.7.
On the other hand, if the bearish market returns, the stock price is likely to find support at $30. However, if this support breaks, the price may move toward the second support level at $20.03.
Conclusion
C3.AI, established in 2009, specializes in developing artificial intelligence software to facilitate digital transformation. In the last quarter, the company recorded a revenue of $72 million, but it is currently operating at a net negative position based on reports.
Despite the financial situation, the stock price is currently experiencing an uptrend. However, there are some resistance levels and support zones visible in the price movement.


