
- The price of AGIX Price is trading near $0.1897. The 24-hour trading volume was at $36.61 Million.
- The AGIX price is observing a fall of -2.07% in the last 24 hours.
- The AGIX year-to-date return is +317.53%.
SingularityNET launched its enhancement protocol SNEP enables its holder to vote on changes to the network’s operations. In March 2020, they added a staking feature that enables users to stake their tokens.
Agix recently released a collaboration known as awakening health, which flourishes in products that leverage AI for healthcare purposes. For the healthcare industry, the first product is Grace which is a humanoid assistant.
Trend Analysis
By considering trend & price information history, we can say that AGIX is in a downtrend. The price has declined -25.51% within a week and we can say that AGIX is showing poor activity.
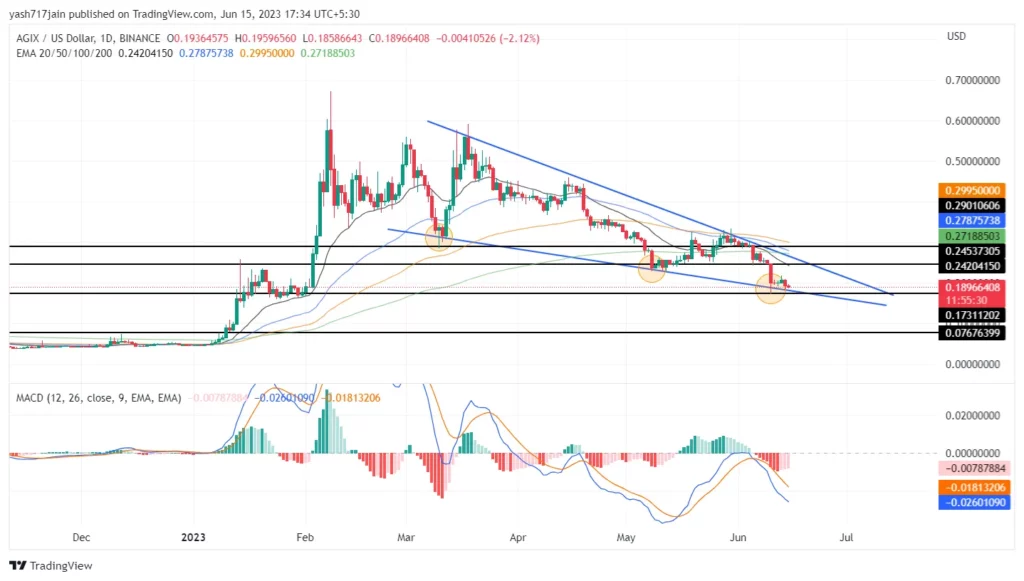
AGIX Price Trading Downwards
Technical Analysis (1D Timeframe)
AGIX Price Analysis
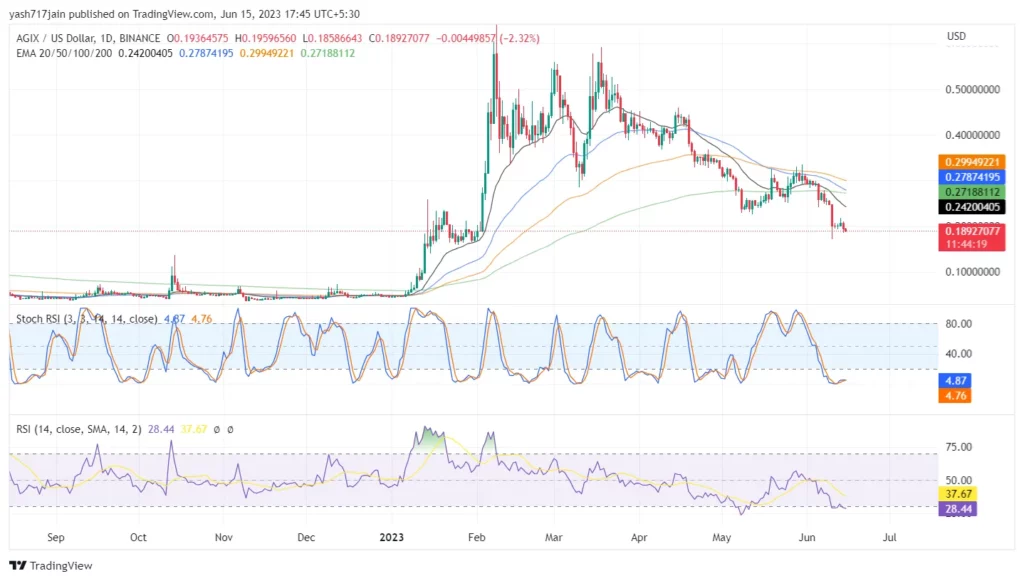
EMA:
The AGIX price is currently below the 20 and 50 EMAs, which indicates that the price will decline in the future. If sellers continue to lower the price, it could drop further in the week. So, it is suggested to sell it.
200EMA:
The price of AGIX at present is trading below 100 & 200 EMA. This suggests the price could fall shortly in the week. If the sellers continue to push the price downwards, it could Fall more in its value within a week. Hence indicating sell.
MACD:
In this case, the MACD line is at -0.0260 and the signal line is at -0.0181. Both are on the negative side and give bearish signals. They are also below the zero line.
Also, when the signal line gets cut by the MACD line from below, the indicator is considered bullish. Likewise, when the signal line gets cut by the MACD line from above, the indicator is considered bearish. In this case, The MACD line crosses from above to below the signal line the indicator is considered bearish. Hence, indicating sell.
RSI:
The RSI line has been moving in the oversold territory for the past few days. The 14 SMA has a value of 37.67 points and the RSI line is around 28.39. This indicates that the AGIX market is in the oversold zone.
Stoch RSI:
The Stochastic RSI fluctuates between 0 to 100. With readings below 20, it is considered oversold and those above 80 reflect overbought conditions. The current %d line is at 4.76 and the %k line is at 4.87. This indicates that AGIX is in an oversold zone.
Trendline Analysis:
As per the Trendline, it seems it’s respecting the Trendline as the price is following a descending channel as shown in the chart. For now, it’s declining from the trendline but can go downwards more shortly. So, the price of AGIX can continue to Fall or consolidate within the trendlines range.
Conclusion
According to the analysis, the indicators are supporting the bears. If the price continues to move under the seller’s control, it is expected to fall more soon or it can consolidate at the current levels. Presently, the sentiments of the investors and traders are bearish regarding the price of AGIX in the 1D timeframe.
Technical Levels:
- The Nearest Support Zone – $0.1731 then $0.0767
- The Nearest Resistance Zone – is $0.2453 then $0.2901
Disclaimer
In this article, The views and opinions stated by the author, or any people named are for informational purposes only, and they don’t establish investment, financial, or any other advice. Trading or investing in cryptocurrency assets comes with a risk of financial loss.


